bootstrap website templates

Demand Calculations

The current total electricity demand at the Isle of cumbrae is calculated by considering both domestic and non-domestic demands. In addition, a 10% marginal for the future demand is also considered.

Domestic demand - The Isle of Cumbrae has around 1,347 dwellings with 30 % of them are second homes [1][2]. We have used the UK government website to get the domestic demand data. In the website, the electricity demand data are available at the Lower Super Output Area(LSOA) and middle super output area (MSOA) levels[3]. The MSOA level includes demand data from the wider areas, and LSOA level gives data from the small regions. We have identified LSOA code 'S01011327' and 'S01011328' are part of Great Cumbrae[1][2]. Then, we calculated the domestic electricity demand based on these codes by using the LSOA domestic electricity-2016 information from the government website. The spreadsheet that we have used for the domestic calculation can be found here.

Non-domestic demand - We were unable to find the non-domestic demand data at the LSOA level. Therefore, we have adopted a different technique to calculate non-domestic demand data. Here, first we have identified the non-domestic users at the Cumbrae separately from the UK government website [4]. Later, calculated demand manually by using the Google Earth Pro application(for Area measurements) and CIBSE guide (for typical electricity benchmark, kWh/m^2). The spreadsheet that we have used to calculate non-domestic users can be found here.

Future demand - By considering the future development plans described in the North Ayrshire council's 'Millport Conservation Area Appraisal' document, we have considered 10 % marginal for the future demand. The appraisal document can be downloaded from here.

Electricity demand 

The below table shows the calculated demand for a year by using the different sources as described above. The annual demand is estimated around 9.5 GWh, and it gives the daily load of around 26 MWh. Later, we have generated demand curve for a year from the annual electric consumption data. The obtained demand curve is shown in figure 1.

CategoryAnnual electricity demand (GWh)
Domestic demand7.61
Non-domestic demand1
Future demand0.86
Total demand9.5

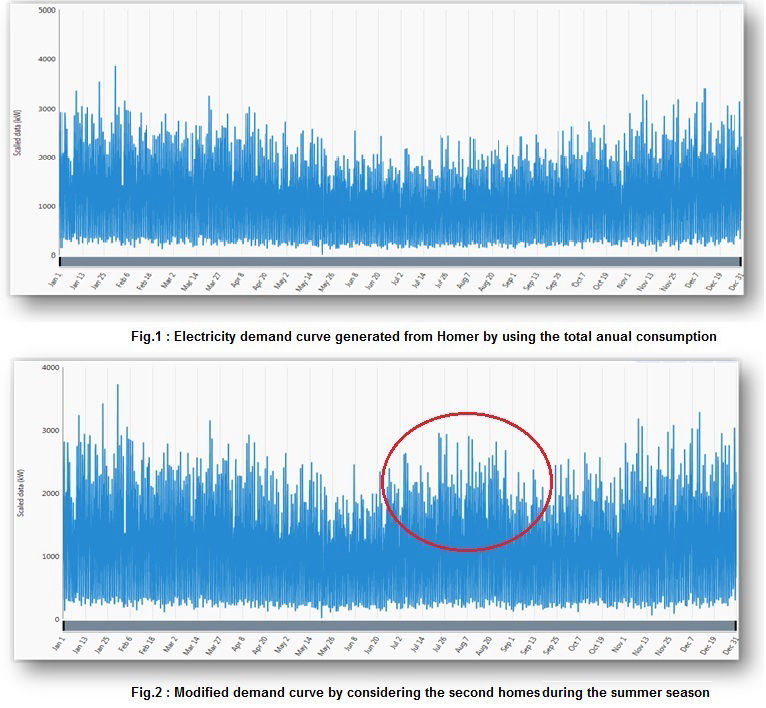
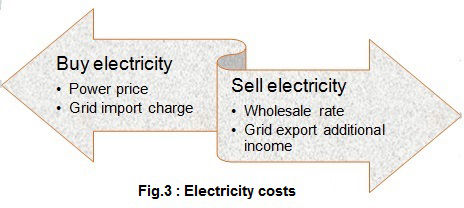
Electricity Demand Curve

We have used Homer to generate the yearly demand curve from the annual electricity consumption. In Homer, the demand curve is developed based on the peak month selection. In general, as we know January is the peak month in Scotland, we have selected the same. The resulted curve is shown in figure.1. In summer, it is considered to be a favorite period for tourists to visit their second homes, which account for approximately 30% of overall houses in Cumbrae. For this reason, we are expecting a higher demand during these periods. So, we manually changed the curve during the summer periods and developed the final demand curve shown in figure.2.

Mobirise

Cost of electricity (COE)

In order to design suitable models for the Isle of Cumbrae to meet the demand at reduced electricity price, it was necessary to establish the baseline cost of electricity(COE). At the same time, we considered the possible potential income as a result of exporting electricity back to grid.

In the UK, there are different charges involved while selling electricity back to the grid or buying electricity from the grid. Some of those are given in figure 3.

Mobirise

Sell electricity- In case of surplus electricity from the renewables generation, normally the excess electricity is exported back to the grid. Nowadays, while exporting one can get mainly two different profits. First one is according to the wholesale rate, and the second one is seasonal(summer/winter) additional income. Both wholesale rate and seasonal prices vary throughout the year. In this project, to make our models more realistic we have used the wholesale selling rate available on the government websites[5]. Also, we have added seasonal charges to the wholesale selling rates. We have considered the wholesale selling rate for the year 2017 in our models and is shown in figure 4.

Mobirise

Buy electricity- Similar to the above case, while buying electricity, consumers need to pay a price fixed by the power company. It involves all kind of charges such as transportation charges, a seasonal(summer/winter) import charges, operating costs etc. For simplicity, we assumed Cumbrae own the grid and fixed the power price as 10 pence/kWh.

CO2 emissions

To calculate the reductions in carbon dioxide emission for our models, it was necessary to establish the current CO2 emission because of the use of electricity from the central grid at the Isle of Cumbrae . We have assumed current emission is roughly as 600g/kWh, and then, calculated the total CO2 emission at Cumbrae as 6000 tonnes/year.                                                                                                                                                                           The baseline model that we designed in HOMER to establish the current COE and CO2 emissions are given in figure 5. To know more about the generator and grid in the model please click here.

Mobirise

Hence, from the basic model, we got the current COE as 9.88pence/kWh, and C02 emission as 6,000 tonnes/year.
Note:- By considering the salvage value of generator, a small decrease in COE has resulted from the power price of 10 pence/kWh. 

References

  1. Scottish Government. ([ca.2014]). Largs Central and Cumbrae - 06 [online]. Availabe from: http://statistics.gov.scot/atlas/resource?uri=http%3A%2F%2Fstatistics.gov.scot%2Fid%2Fstatistical-geography%2FS01011327&inactive=false [Accessed 03 Feb 2018]
  2. Scottish Government. ([ca.2014]). Largs Central and Cumbrae - 07 [online]. Availabe from: http://statistics.gov.scot/atlas/resource?uri=http%3A%2F%2Fstatistics.gov.scot%2Fid%2Fstatistical-geography%2FS01011328&inactive=false [Accessed 03 Feb 2018]
  3. UK government. ([ca.2018]). Lower and Middle Super Output Areas electricity consumption [online]. Availabe from: https://www.gov.uk/government/statistics/lower-and-middle-super-output-areas-electricity-consumption [Accessed 28 Jan 2018]
  4. UK government. ([ca.2018]). Companies house [online]. Availabe from: http://download.companieshouse.gov.uk/en_output.html [Accessed 08 Feb 2018]
  5. ELEXON. ([ca.2018]). Electricity Data Summary [online]. Availabe from: https://www.bmreports.com/bmrs/?q=eds/main [Accessed 27 Feb 2018]

Address

Department of Mechanical & Aerospace Engineering,  James Weir Building, Level 8,  
75 Montrose Street
Glasgow G1 1XJ
Scotland, UK


Reach us at : 

Contact us